Data Fusion
University of Sheffield, Department of Information Studies 2003-05
This research was supported by Pfizer and carried out in the Chemoinformatics Group of the Dept. of Information Studies.
Principles of Data Fusion for Retrieval
Data Fusion is the idea that two or more sources of data can be combined to give a better results. We unconsiously use the principle every day when we cross the road: we look and listen to combine information from our eyes and our ears and thus improve the detection of traffic before deciding whether it is safe to cross. There are many examples and applications: in the military it is used in target recognition and de-mining, in Information retrieval, metasearching uses two or more search engines, it is also used in text categorization; in artificial intelligence pattern recognition and machine learning. In Earth observation the combination of several semi-independent bands or frequencies gives improved categorisation of landcover types (e.g. Landsat and this recent ESA article ).
In the context of virtual screening, the different sensors correspond to different ways of ranking a database of previously untested molecules in order of decreasing probability of activity, with the aim of enabling better decisions to be made as to which few molecules should go forward for biological testing. The interest is in concentrating those molecules that have the best chance of being active in the top ranks. The test is to improve the recall of known active molecules.
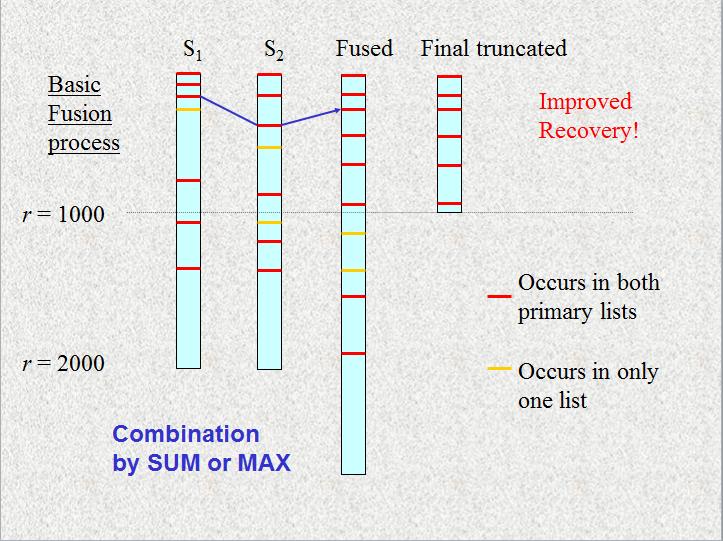 Figure 1
In figure 1 S1 and S2 represent two lists of compounds obtained by comparison with the same molecular structure of a compound known to be "active" in some way but using different similarity coefficients. According to the similarity principle compounds with similar structure have a higher chance of having similar active properties, hence known actives (shown in red) should crowd towards the top of each column. We might then expect undiscovered actives to be found with higher likelihood in the remaining blue regions. A new list is then prepared either by adding the similarity values when the same compound apears in both primary list (the SUM rule) or the maximum value is used (the MAX rule). The rank can also be used in place of the actual similarity value. For compounds that only occur once some ansatz is used e.g.: assign a second value equivalent to the lowest value seen in each list. The new list is then ordered and truncated to the reference rank for comparison. In this example 4 actives are found at rank 1000 in each of the primary lists but 5 have been retrieved in the fused list when truncated at rank 1000.
Rather than use different similarity measures it is also possible to fuse the similarity lists from two or more structurally related active compounds. This is "group fusion" and can lead to significant improvements over the results obtained by using a single active [1].
How Does Data Fusion Work?
Available theories of Data Fusion involve a study of errors and how these are reduced by sensor combination. This applies to the efficacy of detection or classification of a single result, e.g. estimation of the landcover type of a single pixel from an image scene observed at different frequencies. For virtual screening and other retrieval systems the key measure of efficacy is the recall, which is an accumulated signal not readily approached by available theories. For retrieval, data fusion is often but not always effective and it is unclear how to choose between data fusion rules. Of these the SUM and MAX rules are the most commonly applied, but a number of alternatives can be devised. Given a dataset it would be highly desirable to know beforehand if data fusion would be effective and which rule to apply. For retrieval to be effective something has to distinguish the distribution of actives from non-actives in a list and the retrival method then takes advantage of that difference. In the lists S1 and S2 in the figure above, actives crowd towards the top of the lists because they have been ranked according to similarity with a known active. Retrieval by creaming off the top-ranking compounds is then an effective way of choosing more actives than applying a random screen. To see what is happening in data fusion it is helpful to plot the results of two similarity searches against each other (Figure 2). In this plot each red point represents the comparative similarities of a pair of known active compounds as measured by the Tanimoto (x-axis) and Russel-Rao(y-axis) similarity coefficients. The grey points do the same for inactive compound pairs.
 Figure 2
 Figure 3
For a bivariate distribution we found [2] that Data Fusion can be represented as an integral over some region (Figure 3). The rank increases as the size of the region increases and more points are chosen. With this understanding it is clear that Data Fusion can only be effective (1) if, on such a plot, the distribution of active points covers a sufficiently different region to the inactive points and (2) if the region of integration corresponding to the fusion rule is able to capitalise on this difference and pick out more active points than inactive points for at least some values of rank.
The regions picked out by the SUM and MAX rules are shown in Figure 4.

 Figure 4
If actives crowd towards the top of two similarity lists such as S1 and S2 then retrieval from either list should give better than random results at high rank. We found that Data Fusion using the SUM-rule may improve the results if the values representing two different similarity measures between active compounds are correlated more than those of the recovered-nonactive values. However, Fusion using the MAX-rule becomes advantageous at high rank if there is reduced correlation between the recovered-active similarities relative to the recovered-nonactive values. However, it remains difficult to guess before the event which scenario will apply in practice[2].
Analysisn for the combination of several lists, as in group fusion, involves multiple integrations and becomes problematical. However, by mapping the precision, (the fraction of active compounds to total compounds retrieved over a given region or rank) for 2-D projections obtained from plots related to Figure 2, we were able to visualize the process of group fusion, which is consistently successful. These showed that the highest concentrations of active matched compounds appear in regions that correspond closely with the two-dimensional MAX-rule region. This pattern seems to lie at the root of the observed superiority of MAX over the SUM-rule for group fusion[3].
References
- Martin Whittle, Valerie J. Gillet, Peter Willett, Alexander Alex and Jens Loesel. Enhancing the Effectiveness of Virtual Screening by Fusing Nearest Neighbor Lists: A Comparison of Similarity Coefficients Journal of Chemical Information and Computational Science 44, 1840-1848, (2004). Abstract.
- Martin Whittle, Valerie J. Gillet, Peter Willett and Jens Loesel. Analysis of Data Fusion Methods in Virtual Screening: Theoretical Model. Journal of Chemical Information and Modelling 46, 2193-2205, (2006). Abstract.
- Martin Whittle, Valerie J. Gillet, Peter Willett and Jens Loesel. Analysis of Data Fusion Methods in Virtual Screening: Similarity and Group Fusion. Journal of Chemical Information and Modelling 46, 2206-2219, (2006). Abstract.