
FBD images
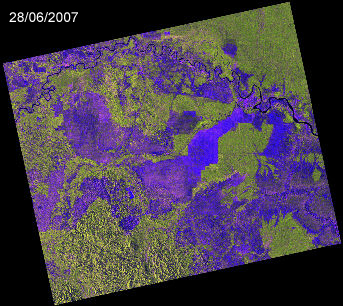

FBD images, covering 70km in range and 59km in azimuth, showing the HH channel in red, HV in green and HH/HV in blue. As forest canopy consists of many scatterers with
different orientations it tends to depolarise the scattered signal - hence green often indicates forest cover. Comparing the two figures
will show that a number of green areas have changed over the intervening year - often as a result of deforestation.
Back to data